
From Dashboards to Decisions: The Startup Analytics Stack That Actually Drives Growth
Learn how to build a modern startup analytics stack in 2026. Clean data, defined metrics, focused dashboards, and AI insights that actually drive decisions.
CAREERSTARTUPS
Alexander Pau
3/1/20264 min read
Startups Don’t Lose Because They Lack Data
They lose because they move too slowly on the wrong signals.
In 2026, execution speed is leverage. And a clean startup analytics stack is the operating system behind it.
Most teams think they need better dashboards.
What they actually need is a system that turns numbers into decisions.
Analytics isn’t about charts. It’s about clarity. And clarity compounds.
Why Startup Analytics Still Fails
Startups don’t fail because they lack data. They fail because they can’t trust it.
The pattern is predictable:
Dashboards built before metrics are defined
Multiple versions of “active user”
Revenue calculated three different ways
No clear metric ownership
Analytics engineering emerged to fix this exact issue. It focuses on cleaning, modeling, and standardizing data before it hits dashboards. dbt explains the discipline well here:
https://www.getdbt.com/blog/what-is-analytics-engineering
Skip this layer and your business intelligence becomes a debate club.
And once trust erodes, adoption dies.
What This Looks Like in Scaling Startups
Many 15–30 person teams hit the same wall:
Dashboards multiply
Metric definitions drift
Leadership meetings turn into reconciliation sessions
The fix isn’t more tools.
It’s five things:
Define five core metrics tied directly to company OKRs
Standardize them in one semantic layer
Remove redundant dashboards
Assign clear metric ownership
Review weekly
When clarity improves, meeting time drops.
Debate decreases.
Priorities sharpen.
Not because the charts changed.
Because the system did.
The Three Jobs of Business Intelligence for Startups
Forget features. A modern data stack has three jobs.
1. Leadership Insight
What’s actually moving the needle? Growth rate? Retention? Sales velocity?
If leadership can’t answer that in two minutes, your stack is broken.
2. Execution Signal
Where are teams stuck? Is churn rising? Is cycle time creeping up?
Dashboards should trigger action, not admiration.
3. Single Source of Truth
One definition of revenue. One retention formula. No shadow spreadsheets.
Even Gartner’s definition of business intelligence reinforces this: BI exists to support better decisions, not just reporting.
https://www.gartner.com/en/information-technology/glossary/business-intelligence-bi
If your dashboards don’t change behavior, they’re decoration.
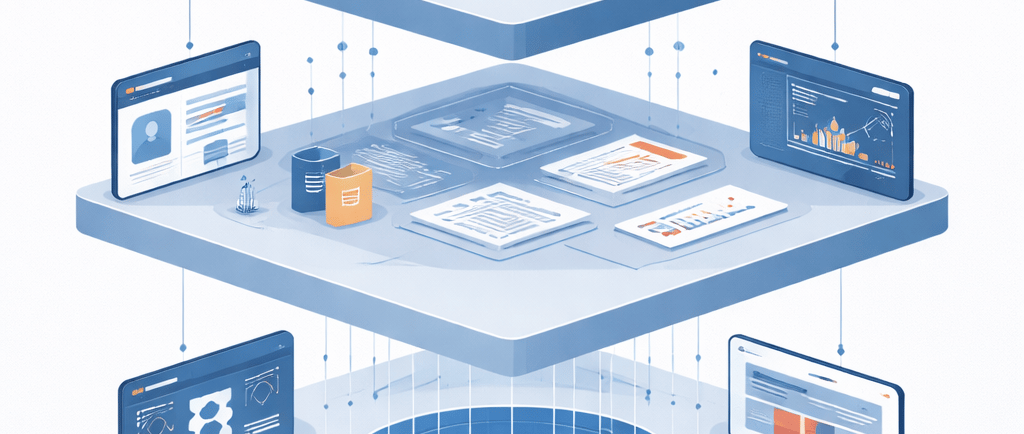
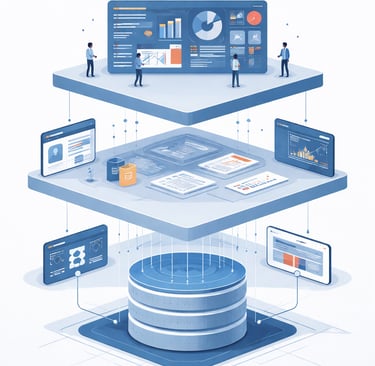
The Five Layers of a Modern Startup Analytics Stack
This is where most teams get it wrong. They jump straight to visualization.
Don’t.
1. Data Collection & Ingestion
CRM. Product analytics. Marketing platforms. Finance tools.
Early teams manually export CSVs. That works — briefly.
Operator rule: ingest first, analyze second.
If data isn’t centralized, you’re guessing.
2. Transformation & Modeling
This is where metrics are defined.
Revenue. Retention. Churn. CAC. LTV.
Without proper modeling, each department defines them differently.
I break down this issue in Why Your Data Model Isn’t Wrong, It’s Just Solving the Wrong Problem:
https://sharpstarts.com/why-your-data-model-isnt-wrong-its-just-solving-the-wrong-problem
The issue usually isn’t SQL skill. It’s unclear objectives and inconsistent grain.
When definitions are standardized here, dashboards stop contradicting each other.
3. Warehouse / Semantic Layer
Think of this as your metric contract.
One agreed definition of revenue.
One retention formula.
One churn metric.
It sounds boring.
It’s not.
It’s the difference between alignment and chaos.
4. Visualization & Alerts
Now you build dashboards.
Power BI. Looker. Tableau. The tool matters less than the discipline.
Here’s the filter:
If a dashboard doesn’t trigger a weekly decision, it shouldn’t exist.
I unpack this further in Power BI + OKRs: How Leaders Turn Dashboards Into Execution:
https://sharpstarts.com/power-bi-okrs-how-leaders-turn-dashboards-into-execution
Dashboards should shorten meetings, not extend them.
5. AI-Assisted Insights
This is where the modern data stack gets interesting.
AI can:
Summarize performance
Flag anomalies
Forecast trends
But here’s the mistake most startups make:
They layer AI on top of messy foundations.
AI amplifies whatever system you already have. If your metrics are inconsistent, AI will scale the confusion.
Adopt AI after your stack is clean — not before.
Tools by Startup Stage
The right analytics stack depends on your stage.
Early Stage (1–15 people)
Keep it lean.
Centralized ingestion
Basic transformation
One or two dashboards
Speed > perfection.
Overengineering here kills momentum.
Scaling Stage (15–50 people)
Governance becomes critical.
Metric definitions need documentation. Dashboards need ownership. Tool sprawl needs containment.
I wrote about this pattern in Tool Sprawl Is Quietly Killing Startup Execution:
https://sharpstarts.com/tool-sprawl-is-quietly-killing-startup-execution-and-most-teams-dont-notice
More tools rarely mean more clarity.
Growth Stage (50+ people)
Now you optimize for scale and automation.
Real-time pipelines
Automated anomaly detection
Integrated reporting into planning cycles
At this point, analytics isn’t a function.
It’s infrastructure.
The Most Common Operator Mistakes
Here’s where modern startup analytics breaks:
Too many dashboards
Vanity metrics instead of leading indicators
No metric owner
Governance added only after something breaks
Governance sounds bureaucratic — until you need it.
It’s the hidden operating system of growth:
https://sharpstarts.com/governance-is-the-hidden-operating-system-of-growth
Without it, analytics becomes noise.
A 90-Day Startup Analytics Reset
If your stack feels messy, start here.
Month 1
Centralize ingestion. Define five core metrics tied to OKRs.
Month 2
Standardize definitions. Build a clean semantic layer. Kill redundant dashboards.
Month 3
Launch two core dashboards. Assign ownership. Review weekly. Add light automation.
If you’re unsure which metrics matter most, Y Combinator’s guide to startup metrics is a solid reference:
https://www.ycombinator.com/library/6m-startup-metrics
Notice how few metrics actually drive outcomes.
That’s intentional.
Execution Is the Advantage
In 2026, every startup has access to the same tools.
The advantage isn’t dashboards.
It isn’t AI summaries.
It isn’t prettier reports.
It’s clarity.
Clarity on what matters.
Clarity on what’s broken.
Clarity on what to fix next.
A clean startup analytics stack doesn’t just inform decisions.
It removes friction.
And the teams that remove friction move faster.
That’s the edge.
📚Further Reading
Tata Group Governance Lessons – How large conglomerates handle succession and authority.
Metro Vancouver Board Review – Understanding trade-offs between representation and decision speed.
WSJ on DEI Board Changes – When changing who sits at the table doesn’t fix governance.
OECD Digital Governance Index – Best practices for formal oversight and accountability.
Participatory Budgeting Overview – How rules make decentralized decision-making effective.
TL;DR
Dashboards ≠ decisions.
Clean data → defined metrics → focused dashboards → then AI.
Kill vanity metrics and tool sprawl.
Build for clarity. Scale with discipline.